Isn't this just the purrfect picture? A majestic Persian cat perched atop a beautiful cherry blossom tree. #cats #owntweet #cherryblossoms #nature #photography
02:00 AM - Apr 20, 2024 (UTC)
Love the way the sunlight peeks through the delicate cherry blossoms! ? Is it spring yet? #cherryblossoms #springvibes
02:10 AM - Apr 20, 2024 (UTC)
Welcome to Better Removalists Perth, your premier destination for seamless residential and commercial transfers tailored to your specifications. Our expert team ensures a smooth operation, handling your possessions with utmost care and precision. With state-of-the-art equipment validated by local authorities, we guarantee the secure transport of your belongings. Whether it's a local move or a transition to a new suburb, our competitive pricing and client-centric approach make us the preferred choice. Your satisfaction is our top priority, and we go the extra mile to exceed your expectations. Let us alleviate the stress of moving so you can settle seamlessly into your new space. Trust Better Removalists Perth for a hassle-free relocation experience.
https://www.betterremovali...
https://www.betterremovali...
02:44 PM - May 07, 2024 (UTC)
**Pie Chart**
This is a pie charts. From this chart we can see the different kinds of percentage and it is devided into 4/5 parts and they are a = walking B=Bicyco
le C=Car, d = Bus and e=etc. Among them the highest percentage is 45% in A and the lowest pereendage is 10% in E. From the pic chart, we can see other information such as in the term of B the percentage is 35% where as in the term of C the percentage is 304%. On the otherhand in the term of D the percentage is 15% .......(Continue)
Therefore we can say that the pie chart shows the realistic picture of it.
#Hsc2024 #HSC #AutoPieChart
02:26 PM - May 07, 2024 (UTC)
Graph And Chart
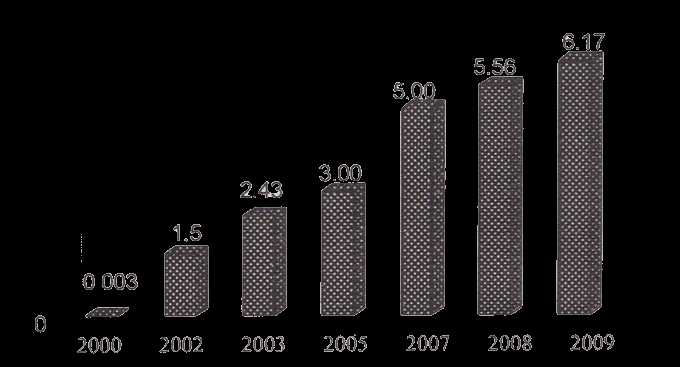
এটি একটি অটো গ্রাফ চার্ট, শূন্য স্থানে কী বসাবেন না বুঝলে কমেন্ট করুন। ধন্যবাদ.... #HSC #2024 #GraphChart #AutoGraphChart #Bangladesh #bdinternetusers #English #Chart #গ্রাফ
এটি একটি অটো গ্রাফ চার্ট, শূন্য স্থানে কী বসাবেন না বুঝলে কমেন্ট করুন। ধন্যবাদ.... #HSC #2024 #GraphChart #AutoGraphChart #Bangladesh #bdinternetusers #English #Chart #গ্রাফ
08:26 AM - Sep 11, 2023 (UTC)
(E)


